For the Ball State Honors College, every senior must complete a Honors Thesis. This thesis can either be something related to their major, something they feel was lacking during their time at Ball State, or something completely unrelated to anything they did. I had taken one class in computer graphics, but it was not as encompassing as I had hoped when I signed up for it. Seeing as my ultimate goal is to work at an animation company on their animation software, I decided to educate myself in the rendering algorithms that make 3D animation possible.
I started working on this project the summer of 2015 and finished the paper in April 2016. The thesis has two main parts. The first details a handful of algorithms that were developed over the years that were important to the industry. These include hidden line and z-buffering algorithms, scanline algorithms, ray tracing algorithms, radiosity algorithms, Monte Carlo algorithms, and the rendering equation. The second part details my own tests based on a ray tracer I created in Java.
One of the books that I found in the Ball State Library was the first edition of Peter Shirley's Realistic Ray Tracing. Because of the step by step description of how to create your own ray tracer, I decided to use this book to create my own ray tracer. I knew that by creating my ray tracer in Java, the language I am most competent in, I could then easily create an Android application using the same code. While I started working through the book I also suggested that Ball State obtain the second edition because I had heard that it was slightly easier to understand and had code examples. My ray tracer for this reason is a mix of both versions of Realistic Ray Tracing. If you are interested in seeing how the ray tracer is set up or how I progressed, you can view the project here.
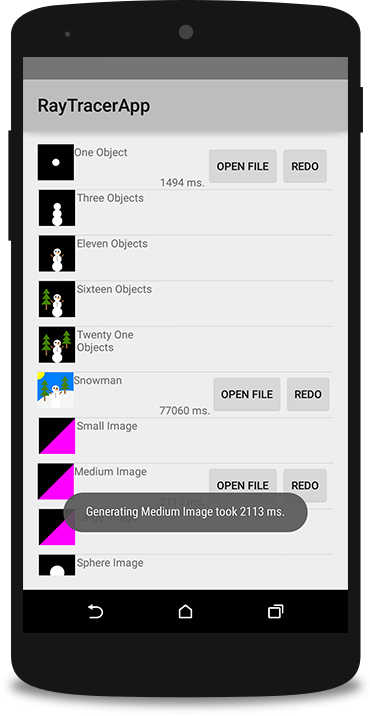
Once I completed the ray tracer to a point where I could create images and had implemented a majority of the functionality I wanted, I started to create an Android application that I could test with. I used my own experience from working at the Digital Corps to create a simple application that would create an image, save the image on the phone, and display how long it took to generate. Some things had to be changed in this process, including the libraries that were used for the creation of images. Android applications currently do not support BufferedImages, so some changes to the ray tracer were needed to support Bitmaps instead. The source code for the app can be found here as an Android Studio application and supports a minimum Android version of 15.
While working through the books, I wondered what objects or aspects of a generated image were the most computationally expensive, especially across different devices. I decided to look at 6 different aspects of my ray tracer that could affect the generation time: the size of a image texture, number of objects, a sphere versus a triangle object, the effect of adding a light to an image, different colorings of an object, and the size of the image. Other than the image size tests, each image is 500 by 500 pixels. I tested these images on my 15-inch MacBook Pro with 16GB running OSX 10.11.2, Intel Core i7 2670QM CPU, and Intel Iris Pro 1536 GPU; an HTC M8 with 2GB running Android 5.0.2, Qualcomm Snapdragon 800 MSM8974 CPU, and Adreno 330 GPU; and a Samsung Galaxy S3 with 2GB running Android 4.4.2, Qualcomm Snapdragon S4 Plus MSM8960 CPU, and Andreno 225 GPU. Each image was generated ten times on each device and an average time is shown on the graphs included. All graphs are shown with the y-axis being in terms on milliseconds.
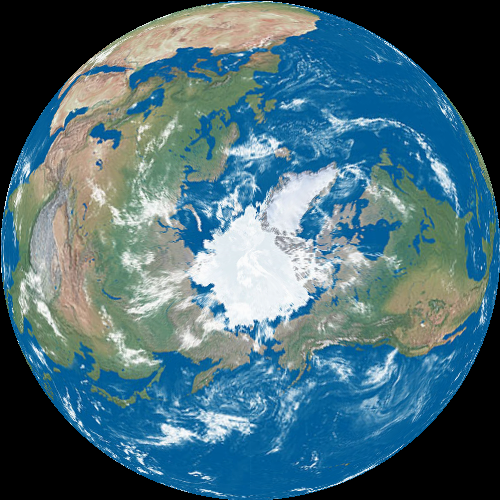
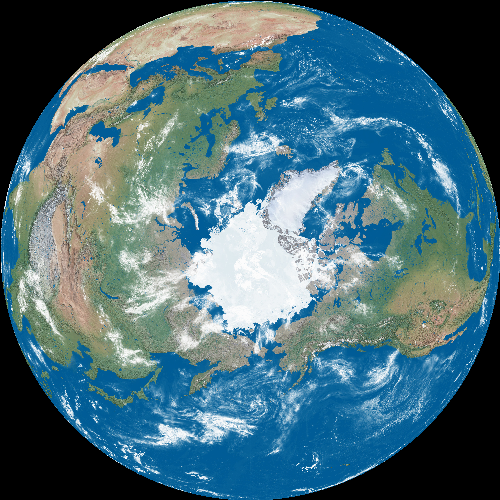
I took a rectangle image of an unwrapped globe and used that as a texture for a sphere. The purpose of these tests were to see how much more time was needed when a texture such as this was doubled or more for better quality. I used the same texture for each sphere but increased the sizes from 512 pixels by 1024 pixels to 1024 pixels by 2048 pixels to 2048 pixels by 4096 pixels to finally 4096 pixels by 8192 pixels. Unfortunately, only the laptop was able to create an image with the last three sizes. The phones both ran out of memory before the images could be completed and saved.
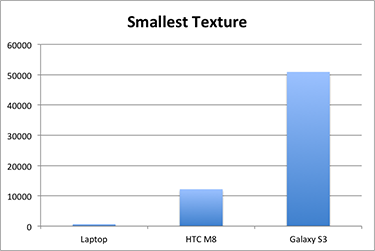
When comparing the smallest texture to the largest one, it may be hard to see the differences at first. However, the second image has slightly more definition and features than the other. The ice at the equator has a few extra colors and the shapes of the clouds are more pronounced. Something that particularly jumps out is the gray area around the Himalayan Mountains. It has more depth than the smaller texture, something that can also be seen in the mountain areas of North America. Larger textures would not be suitable for devices such as smartphones that do not have the memory to produce such detailed images, but more memory can lead to more detailed and brightly colored objects than what phones can.
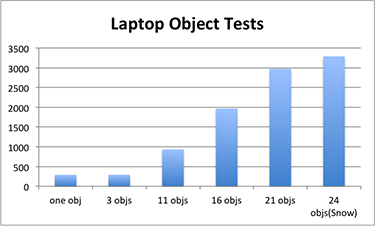
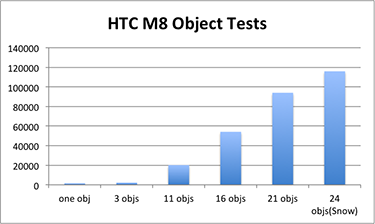
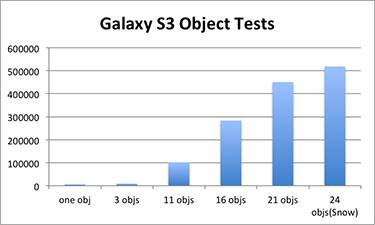
The first tests I decided to try were just to see how much more computational power was needed by adding a few objects. I drew out the layout for the image over Christmas break, hence the snowman theme. I started out with one object, the next with three, then eleven, sixteen, twenty one, and lastly twenty four objects. As expected, the laptop was able to generate the image much faster than the HTC M8 which was much faster than the Galaxy S3. The graphs showing the time for each of these images is not included, because of this fact. However, I do include the graphs for each platform that the images were tested on below.
When I saw the results of these tests, I found the big jump from three objects to eleven objects very interesting. It was more than three times the amount of time it took to generate three objects. This eventually lead me to complete the tests on a sphere versus a triangle object.
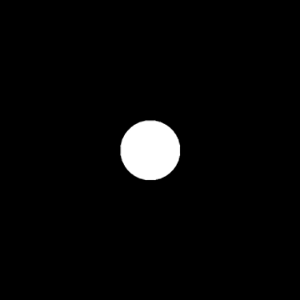


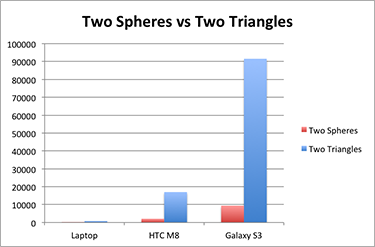
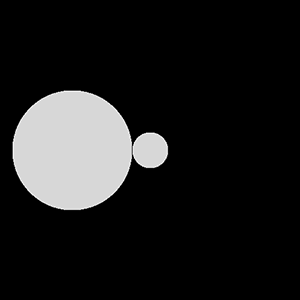
When I conducted the object tests, it occurred to me that generating a triangle could possibly take more power than generating a circle. I completed four tests in total: an image with one sphere, an image with one triangle, an image with two spheres, and an image with two triangles. To keep each case similar, I calculated the area of the triangles to have the same area as the circles that would be shown on the image.
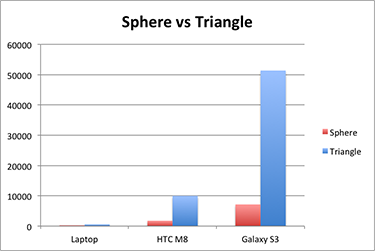
As I observed in the object tests, computing triangles was much more computationally heavily than creating spheres. This makes sense when you take into account the math that is needed to generate a triangle. When doing so, it is necessary to calculate where the center of the triangle is in respect to its points. This added complexity causes the computation time to be much larger.
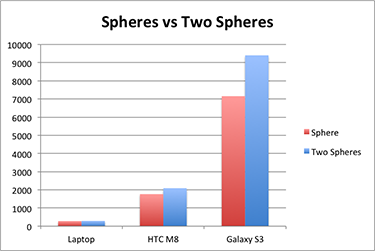
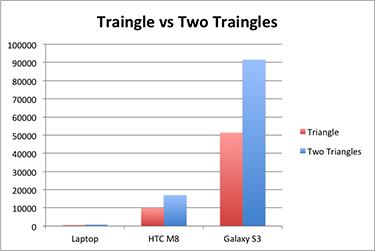
I found it interesting as well comparing how much more time was needed when adding a second sphere or triangle. On each devices, not that much more time was needed for the addition of one more sphere. However, the opposite was true of adding another triangle, again because of the amount of math needed to create it.
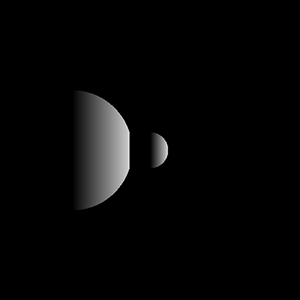
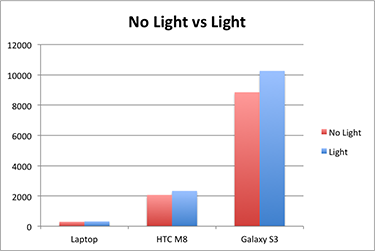
Something that I guessed would cause more time to produce was the addition of a light source. I was surprised to see that the adding one light to a scene really did not increase the time by very much. Just from looking at the output and thinking about how lights and shadows are implemented, I attributed this to the fact that before the color of pixel is determined, it is first checked if there is a shadow ray from a given light to that pixel as well. Since a little less than half of the pixels were hit by a shadow ray, that pixel is just assigned the ambient color instead of calculating the color of the pixel.

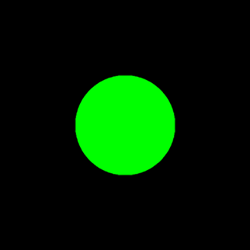

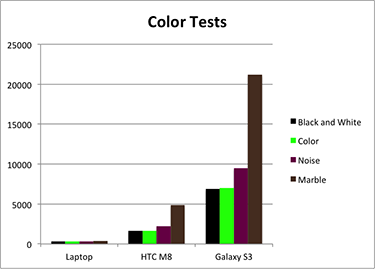
I wondered if the colors or textures that an object had would affect the processing time as well. I created an image that had a white sphere, another with a green sphere, a sphere with a algorithmically generated noise texture, and a sphere with an algorithmically generated marble texture. The difference between the first two images was almost nothing, even on the Samsung S3 which has proven itself to be the device that had the most trouble generating things. The noise texture, because of the complex mathematics involved, takes slightly longer to produce. The marble texture uses some of the same mathematics as the noise texture on top of its even more advanced computations, causing it to take the longest to be produced on each device.
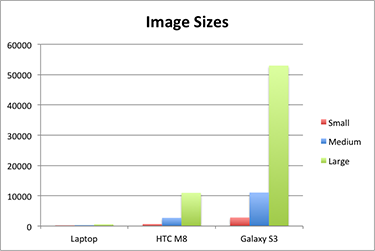
I next decided to look at how different sized images would affect the processing time needed. I created an image that had a colored triangle covering half of the image at sizes 125 pixels by 125 pixels (small), 250 pixels by 250 pixels (medium), and 500 pixels by 500 pixels (large). While there was very little difference in processing time on the laptop, that cannot be said for the smartphones.
If you are interested in learning more about my work or would like to read a copy of my thesis, please contact me at jessicaalohse@gmail.com.